Before we actually start working on our new Laravel application, let’s set up our PHP development environment in Ubuntu/Linux Mint. We’ll develop using the Aptana IDE (integrated development environment), which is a web development-specific version of the popular open-source Eclipse IDE. Likewise, we’ll set up the excellent XDebug debugger to help us develop more effectively.
- To use Aptana (or Eclipse), we must have Java installed on our system. In most cases, Java will already be installed, but just to confirm that you have it, run this command in the Terminal:
java -version
You should see something similar to this in response to the command:
java version "1.7.0_55"
OpenJDK Runtime Environment (IcedTea 2.4.7) (7u55-2.4.7-1ubuntu1)
OpenJDK Client VM (build 24.51-b03, mixed mode, sharing)
The actual version of Java is not too important, as long as it is 1.6 or greater. (Java’s numbering scheme is a bit confusing and the value after the first decimal is actually the version. For example, “1.6” really means Java 6!)
If you don’t have Java installed (i.e., an error occurs when you check the version), you can install it with this command:
sudo apt-get -y install openjdk-7-jdk
This installs Java 7.
Alternately, you can install Java 6 from the Ubuntu repository, but I recommend using the latest version unless you have a specific need for an earlier version, such as application compatibility. (Note that Ubuntu can support multiple Java JDK/JRE versions, but only one can be active at a time. See the man page for the update-alternatives command.)
After Java is installed, run
java -versionin the Terminal again to make sure it is working correctly. - Now we need to install the XDebug PHP extension to help us with debugging and troubleshooting when we are developing our application with Laravel. XDebug allows you to pause the execution of your code to check the internal values of variables (and even change them!) using breakpoints and to step through individual lines of code to examine what PHP is doing with the data.
Ubuntu has relatively recent versions of XDebug, so we can simply install from the repositories:sudo apt-get -y install php5-xdebug sudo service apache2 restart
After it has installed, open your “phpinfo” page to ensure that XDebug is referenced as one of the loaded modules/extensions (it will be listed toward the bottom). You should see something like:
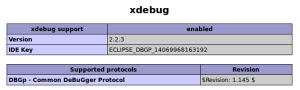
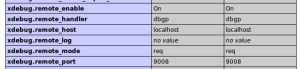
To avoid conflicts with other debuggers, such as for Java, on our system, we are going to change the TCP port that XDebug “listens” on to 9008 (from the default of 9000). First, we need to find the XDebug configuration file: On the “phpinfo” page, look for the Additional .ini files parsed section at the top and find the name of a file which contains “xdebug”, such as
/etc/php5/apache2/conf.d/20-xdebug.ini. Open the XDebug configuration file in a text editor (you will need to usesudo, since this file is “owned” by the systemrootuser!) and add the following lines.xdebug.remote_enable = on xdebug.remote_port = 9008 xdebug.remote_host = localhost xdebug.remote_handler = dbgp
Note: We are only changing the
remote_portsetting from its default (9000). However, for some reason, Aptana (Eclipse) does not recognize the default values of the other settings, so we must set them explicitly.Of course, you can add other configuration settings, as necessary, such as if you are trying to debug on a different machine (by default, XDebug assumes that the “host” to use for debugging is “localhost”, which the name of the machine itself). See the XDebug settings documentation for details.
Restart the Apache web server (
sudo service apache2 restart) and check the “phpinfo” page to ensure that thexdebug.remote_portvalue is now 9008.
- After these preliminaries, we are ready to install the Aptana IDE. From the Aptana web site, download the Linux installation package. Make sure that you download the correct version (32-bit or 64-bit) for your Linux distribution. Extract the archive file and install the application. (I use the handy dtrx utility, which is available in the Ubuntu repositories, to extract the file, since it automatically handles a variety of archive types without remembering all of the different commands and parameters!)
cd ~/Downloads
dtrx Aptana_Studio_3_Setup_Linux_x86_3.6.0.zip
mv Aptana_Studio_3 aptana
sudo mv aptana /opt
sudo ln -s /opt/aptana/AptanaStudio3 /usr/local/bin/aptana
sudo chmod +x /usr/local/bin/aptana
I won’t go into all of the details of these actions, but essentially we are moving the extracted (unzipped) Aptana files to the
/optdirectory and creating a exectuable symbolic (“soft”) link to the Aptana executable file in/usr/local/bin, so that we can launch Aptana from most any directory. We can now run Aptana IDE, either from the Terminal or the Run Application window (<Alt>+<F2>) by simply enteringaptana.So let’s start it up! You’ll be prompted to create (or choose) a “workspace”; just choose the default and check (enable) the Use this as the default and do not ask again option. When Aptana IDE opens, it will display the “Start Page” with some other windows and tabs.
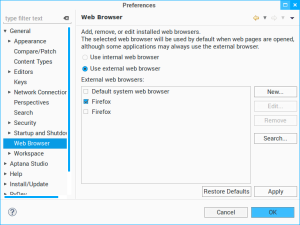
By default, Aptana uses its internal web browser, but I prefer to use Firefox. (You may prefer Chromium or another browser; if so, just adjust these instructions accordingly.) To make this change, choose Window | Preferences from the menus and navigate to General –> Web Browser in the Preferences window. Select the Use external web browser option and then click on Firefox (or your preferred browser!) in the list. You can click on Edit… button to confirm that it is the brower that you expect and enter any command line parameters, such as a specific Firefox configuration, if desired.
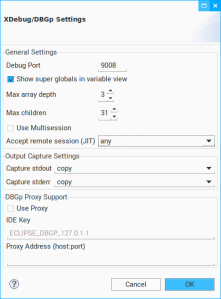
While in the Preferences window, navigate to Aptana Studio –> Editors –> PHP –> Debug. In the Installed Debuggers list, select XDebug and press Configure and change Debug Port to 9008 and Accept remote session (JIT) to any in the XDebug/DBGp Settings window. (You can leave the other settings with their defaults.)
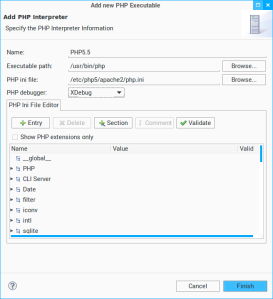
Move to Aptana Studio –> Editors –> PHP –> PHP Interpreters and press Add…. In the Add new PHP Executable window, enter these values/settings:
- Name: PHP5.5
- Executable path: /usr/bin/php
- PHP ini file: /etc/php5/apache2/php.ini
- PHP debugger: XDebug
You may get an error that you don’t have permissions to save thephp.inifile. That’s fine, since we aren’t actually changing it from within Aptana.Of course, this only scratches the surface of the power and capabilities of Aptana (and Eclipse). I recommend looking for other resources on the Internet. Most any article or utility that you find for Eclipse will apply equally to Aptana. Aptana is simply a customized configuration of Eclipse which focuses on web development. (Eclipse was originally created as an IDE for Java development and programming.) For example, most of the plugins on the Eclipse Marketplace (and especially those in the Web category) will work just fine in Aptana. The Eclipse site has has good information about how to install plugins, both from the Marketplace and other third-party sources.
While I (obviously) can’t go into all of details about Aptana (and Eclipse), here are a few plugins that you may want to check out:
- Eclipse Color Themes – Directory of themes (editor color schemes)
- DBeaver – Open-source universal database editor plugin, includes support for MySQL (stand-alone version available, as well)
- Markdown Editor – Free editor plugin for Markdown format, which is often used for documentation
- To test out Aptana and XDebug, let’s create a simple (non-Laravel-based) PHP project.
In Aptana, choose File | New –> PHP Project and:- Enter “Project1” as the name;
- Uncheck Use default location and set the Location as the
Project1directory in yourprojectsfolder (e.g.,/home/username/projects/Project1; and - Press Finish.
The Project Explorer on the left of the Aptana screen will now list
Project1. Right-click on Project1 and choose New From Template –> PHP –> PHP Template from the context menu. When prompted, name the fileTestFile1.phpand press Finish. This will give you a “shell” PHP script file. Change the contents of the file to:<?php echo "<h3>"; echo "My first Aptana PHP script!"; echo "</h3>"; echo "<p>What do you think?</p>"; ?>
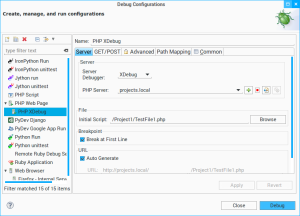
After you save the file, choose Run | Debug Configurations… from the menus. In the Debug Configurations window, double-click on PHP Web Page, which will create a new configuration named “New_configuration”. Rename this configuration to “PHP XDebug” for clarity. Choose XDebug for the Server Debugger. For Initial Script, browse for the
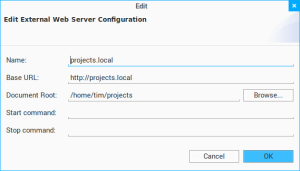
TestFile1.phpwhich you created. Click on the New button (a green ‘+’) next to PHP Server and enter the following details for this debug configuration:- Name: projects.local
- Base URL: http://projects.local
- Document Root:
/home/username/projects, whereusernameis your Linux user ID
Check (enable) both the Break at First Line and Auto Generate options. For convenience, I like to show the debug configurations in the Aptana menus, so navigate to the Common tab and check (enable) Debug in the Display in favorites menu section. Press Apply to save this debug configuration.
We can now actually run the debugger to ensure that it is working. Press Debug button in Debug Configurations window. You will probably receive a warning that XDebug client is listening on a “non-standard” port. This is fine, since we intentionally choose to use port 9008 (instead of 9000), so you can check (enable) Do not warn me again and press Proceed.
In a moment, Firefox (or whatever external web browser you chose above) will launch (or open a new tab, if it’s already open). Simultaneously, Aptana (Eclipse) will prompt you about changing the “perspective” (the display configuration defining what windows and tabs are shown). Press Yes and Aptana will modify the display to show a Debug tab and some variables windows (more about those later!) at the top with your source code window for
TestFile1.phpin the middle.
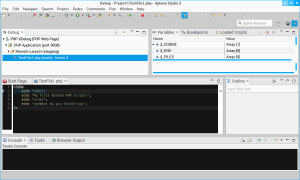
You will notice a (very) small blue arrow on line #2 and that this line is highlighted. Likewise, in the Debug tab, it will show
TestFile1.php.{main} : lineno 2, indicating where the execution paused. This indicates that the debugger has stopped (or “hit a breakpoint” in programming parlance). Even though you did not explicitly set a breakpoint, you will recall that above we checked (enabled) the Break at First Line option. This is a nice way to ensure that the debugger properly launches. We can now let the script continue (“play through”) or execute the script one line at a time (“step through”). Also, you will observe that the web browser appears “stuck” loading the page. This is normal, since the Aptana debugger has paused the execution of the script on the breakpoint.For now, we’ll simply let the script continue (“play through”), since we’ve accomplished our objective of confirming that the debugging is configured properly. Choose Run | Resume from the menus or use the keyboard (<F8>) or toolbar (DVD player ‘Play’ button) equivalents. The Debug tab will show that the session terminated, which is normal, since the script completed successfully. Likewise, the output of the script will be written to the web browser window. Aptana will leave you in the Debug perspective. To return to the “normal” Web perspective, choose Windows | Open Perspective… | Web from the menu (or click on the Web perspective button in the upper right corner).
If you have a problem with your configuration, the web browser will likely display your
TestFile.phppage (hopefully, correctly!), but Aptana will appear “stuck” (or “hung”). In the lower right corner of Aptana on the status line, you should see a message Launching PHP XDebug with a percentage and a progress indicator. Next to it will be a button that looks like a stack of windows with the tool tip Show background operations in Progress view. Click this button and wait for the Progress tab to be shown. The Progress tab should have a single progress indicator that shows “Launching: waiting for XDebug session”. Press the red square button (Cancel Operation) to the right of it to abort the launch of the debugger. Check your LAMP set up and Aptana debugger configuration settings to ensure that they are correct and then try again.


And that’s it! We’ve accomplished a lot in this session. Next time, we’ll start work on our Laravel application itself. See you then!
